Probability and normal distribution

Probability is like guessing one next accurate answer out of many wrongs. It tells you how likely one thing is going to happen. The commonest example would be tossing a coin and bet on heads or tails. Also rolling dice and expect one certain number shows up. This is also commonly known as bernoulli trials.
In making investment decisions, it is important for us to understand the probability of the return on the stock or its earnings per share and the possible outcomes. With the knowledge,we can start to build approximate models to help us evaluate for example the profitability of a trade. We can easily connect the idea of investment with probability as we are all betting the next investment will success.

Normal distribution is probably the most extensively used probability distribution in quantitative analysis. It is also called the Bell Curve or the Gaussian curve after the mathematician Karl Friedrich Gauss.
The normal distribution can be extended by an important result as the central limit theorem. The central limit theorem states the sum and the mean of a large number of independent random variables (n>25) is approximately normally distributed. The chart will closely look like a bell shape which is normal distribution. The larger the number n, the more symmetric the shape of the distribution is.
Brownian motion or Random walk
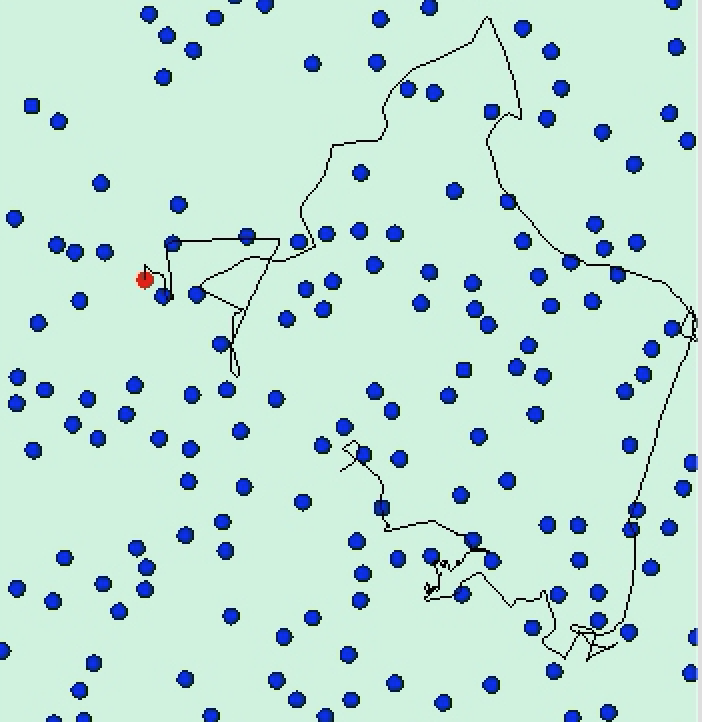
Brownian motion is first used to describe the random movement of gas/fluid particles caused by collisions of molecules that was observed under microscope. The mathematical model of Brownian motion is general used in financial market which are based on the works of Robert C. Merton and Paul Samuelson. Both of them are economists. This concept is extended to financial markets, for example in stock prices cannot be predicted as prices goes up and down randomly like brownian motion or exhibit random walk.
Random walk theory is usually used in a market that important current information is freely available to all participants. In this efficient market, at any point of time or the prices of individual securities can all reflect effects because of those known-information/events. In other words, in efficient market the actual price of securities will have their good intrinsic value.
Famous Black Scholes Equation
Black Scholes Equation is a mathematical model for investment instruments. Fischer Black and Myron Scholes published Black Scholes Equation in their paper “The Pricing of Options and Corporate Liabilities” in Journal of Political Economy in 1973. The fundamental use of this mathematical model is to calculate the value of an option contract entered today. The model provides the foundation as how investment options are being priced.
©Financialclip 2016

Leave a comment